
WiFi Analytics Dashboard for Business ROI
In Brief: A WiFi analytics dashboard should connect network activity with business outcomes by tracking sessions, repeat visitors, dwell time, bandwidth usage, login performance, campaigns, and revenue-related activity. The most useful dashboards allow businesses to compare locations and understand how guest WiFi contributes to customer engagement, operational performance, and ROI.
A guest logs in at 8:12 AM, stays for 47 minutes, accepts your terms, watches a promo, and returns three days later. If your wifi analytics dashboard for business only shows total sessions, you miss the decision-making value in that visit. The right dashboard should help you answer operational questions, marketing questions, and revenue questions from the same set of WiFi interactions.
For hotels, restaurants, retail chains, airports, hospitals, campuses, and public venues, guest WiFi is no longer just a utility. It is an access layer, a communication channel, and a measurable source of business intelligence. That changes what a dashboard needs to do. Basic reporting may satisfy a small single-site deployment, but multi-location businesses and growth-focused operators need analytics tied to customer behavior, network performance, and commercial outcomes.
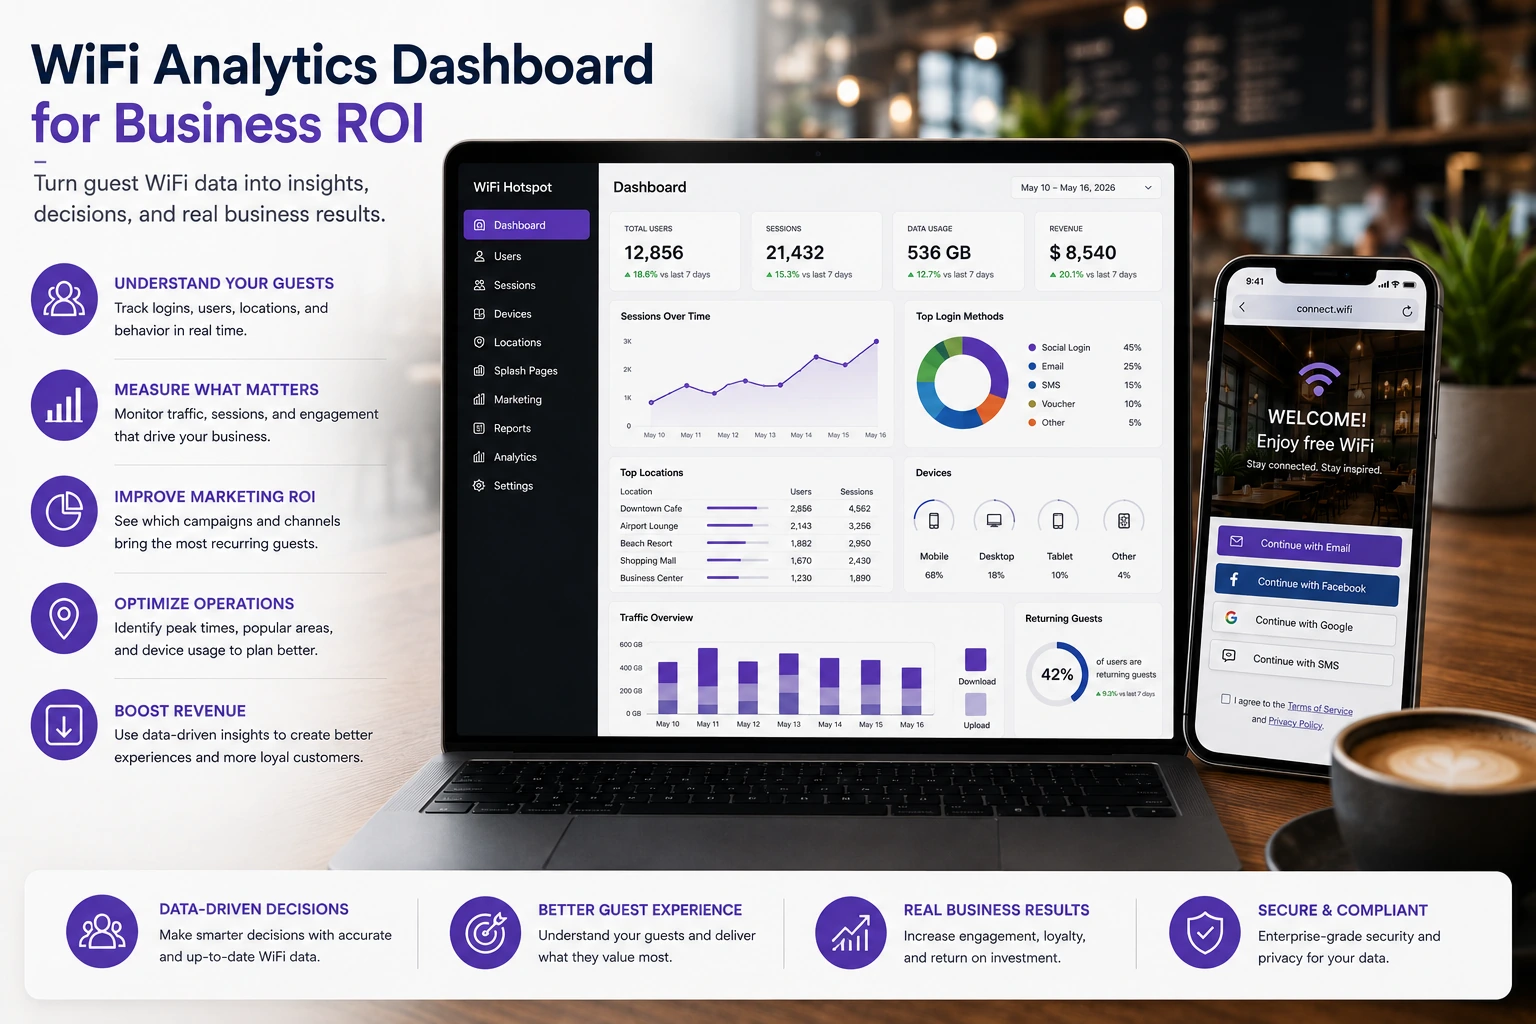
What a wifi analytics dashboard for business should actually show
A useful dashboard starts with visibility into who is connecting, how often, and under what conditions. That includes session counts, unique users, repeat visitors, dwell time, device types, login methods, bandwidth use, and peak usage windows. Those are the baseline metrics, but on their own they do not tell you much unless they are easy to segment by venue, time period, user group, campaign, and access method.
For example, a restaurant group may want to compare lunch traffic against evening traffic across locations. A hotel may care more about occupancy-related usage, premium internet upgrades, or login failure rates by floor. An airport or transit operator may focus on dwell time, concurrency, ad impressions, and payment acceptance. The dashboard has to translate WiFi activity into venue-specific insight, not just present generic charts.
That is where context matters. If your captive portal offers social login, voucher access, paid plans, surveys, or video ads, the dashboard should connect those interactions to outcomes. Which login option converts best? Which promotional message gets the highest click-through rate? Which site has the strongest repeat guest rate? Which location is generating revenue from premium access while another is underperforming? A business dashboard should answer those questions without forcing teams to export raw data and rebuild the story elsewhere.
The difference between network analytics and business analytics
Many platforms claim analytics because they report uptime, traffic volume, connected devices, and access point status. Those metrics matter to IT teams, and they should be part of the picture. But business users need another layer.
Network analytics tell you whether the service is functioning. Business analytics tell you whether the service is producing value. A venue operator may have excellent uptime and poor guest engagement. A retailer may see high connection volume but low repeat visits. A hospital may prioritize secure onboarding and session continuity over ad performance. Different environments need different success metrics, and a strong dashboard lets each stakeholder view the same infrastructure through a different lens.
This is especially important in organizations where IT, marketing, operations, and management all touch guest WiFi. If the dashboard is too technical, commercial teams ignore it. If it is too superficial, IT teams do not trust it. The best approach is role-based visibility: operational health for administrators, customer behavior for marketers, and commercial performance for decision-makers.
Metrics that matter most by use case
There is no universal list of perfect metrics because venue goals are different. Still, certain measurements consistently drive better decisions.
For hospitality, repeat guests, session duration, room or property-level usage trends, and upsell performance are usually more valuable than raw device counts. In food service and cafes, visit frequency, peak periods, and campaign engagement often matter more than long session times. In retail, the key question is whether WiFi data supports footfall analysis, return visits, and targeted promotions. In airports, malls, and transit hubs, large-scale concurrency, dwell time, multilingual portal performance, and ad monetization become more significant.
Educational institutions and healthcare organizations usually put more weight on authentication flows, policy compliance, user segmentation, and service quality. They may still use analytics for engagement and messaging, but the tolerance for friction is lower and access rules are more complex. A dashboard that works well for a coffee shop might be completely inadequate for a campus or hospital.
That is why flexibility matters. A strong wifi analytics dashboard for business should let you customize reporting around the outcomes you actually manage, not force every deployment into the same template.
Why multi-location reporting changes the buying decision
Single-site reporting is easy to oversimplify. Multi-location reporting is where dashboard quality becomes obvious.
A chain with 10, 100, or 1,000 venues needs centralized visibility with local drill-down. Head office wants to compare performance across sites, identify underperforming locations, and standardize campaigns. Local managers need to see their own guest traffic, login success, and customer engagement without getting buried in enterprise-wide data.
This creates a practical requirement: hierarchy. You need dashboards that roll up data globally, break it down regionally, and isolate it by venue. You also need consistent policy enforcement, reporting filters, and user permissions. Without that structure, analytics become a set of disconnected snapshots instead of a management tool.
There is also a deployment trade-off. Cloud reporting is usually the fastest route to centralized visibility and easier administration. On-premise or hybrid models may be necessary for organizations with data residency, compliance, or infrastructure control requirements. The right choice depends on your environment, but the analytics layer should remain consistent across both.
Turning guest WiFi data into revenue and retention
The commercial case for analytics is straightforward: if guest WiFi only provides access, it is a cost center. If it supports monetization, customer data capture, advertising, and repeat engagement, it becomes part of growth infrastructure.
A dashboard helps you prove that shift. You can track voucher sales, premium access purchases, ad views, survey completions, email capture rates, and campaign response by venue or audience segment. You can compare paid access adoption between business travelers and leisure users, or measure whether a promotional video increases conversion in one location but not another.
This is where many businesses underspend on analytics. They invest in access hardware and basic connectivity, then stop short of measuring what the captive portal and guest journey are producing. That limits ROI. If you are already managing branded access, customer onboarding, and on-site communication, the dashboard should show how those actions affect spend, visits, and satisfaction.
Common mistakes when evaluating a dashboard
The first mistake is choosing based on visuals alone. Attractive charts do not guarantee useful reporting. Ask whether the platform supports segmentation, exports, historical trends, role-based access, and comparisons across locations and timeframes.
The second mistake is separating analytics from the WiFi workflow. If login methods, payment flows, surveys, ad modules, and policy controls live outside the reporting environment, teams lose speed and consistency. Integrated analytics are usually more reliable because they are tied directly to access events.
The third mistake is ignoring data quality. If devices reconnect frequently, guests use multiple devices, or sessions drop and restart, headline numbers can be misleading. Good dashboards help normalize that behavior so operators are not making decisions from inflated counts.
The fourth mistake is failing to plan for scale. A dashboard that works for five venues may become difficult to manage at 50. This is where platform architecture matters. Start Hotspot, for example, is built around centralized guest WiFi control, monetization, and analytics, which is exactly what growing operators need when reporting expands beyond a single site.
What to ask before you commit
Before selecting a platform, ask how quickly teams can identify login failures, compare venue performance, and trace customer behavior from first connection to repeat visit. Ask whether the dashboard supports both technical and business stakeholders. Ask whether monetization and marketing metrics are native to the platform or bolted on later.
You should also ask how reporting aligns with your deployment model, your privacy obligations, and your access policies. Some businesses need quick cloud deployment with minimal IT overhead. Others need deeper control, local hosting, AAA Radius integration, or white-label support for managed services. The dashboard should fit that reality without sacrificing visibility.
A good WiFi analytics environment does not just tell you what happened on the network. It helps you decide what to change next. That is the difference between reporting and management, and it is usually where real ROI starts.
Frequently Asked Questions
Which WiFi metrics are useful for measuring business ROI?
Useful metrics can include new and returning visitors, session activity, dwell time, portal conversion, campaign response, surveys, paid access, and location-level trends.
Can WiFi analytics compare performance between locations?
Yes. Centralized reporting can help businesses compare guest activity, campaign performance, network usage, and other metrics across venues.
Are connection counts enough to measure WiFi ROI?
No. Connection totals show usage but not necessarily business value. ROI becomes clearer when WiFi activity can be connected with repeat visits, engagement, campaigns, revenue, or operational improvements.
Prefer Antamedia on Google
Get practical guest WiFi and network management insights directly from Antamedia.